Precision Randomized Controlled Trial Designs
PRCT Hallmarks and Capabilities
Here are some hallmarks and selected capabilities of PRCT designs described for drugs and persons. Please compare the capabilities with what has been and can be accomplished with classical RCT designs. PRCT designs:
- Randomize doses of a particular type of drug to different periods of time for each person. Use within-person randomization to help assure that Precision Quantitative Treatment Response Phenotypes are valid for each person.
- Use SIMA to compute response variable specific Benefit and Harm Scores from two or more repeated measurements of both treatment and health for each person. Use streaming data or multivariate time series as from dosage control and treatment and health monitoring devices and diaries when feasible. SIMA mathematically standardizes within-person Benefit and Harm Scores (mean = 0, standard deviation = 1 unless 0 is the only potential score). Negative scores quantify the amount of evidence for harm. Positive scores quantify the amount of evidence for benefit. Zero-value scores quantify no evidence for benefit or harm.
- Use more repeated measurements to increase power for within-person inference. This is power to help separate treatment effect signals from noise. More repeated measurements yield Precision Quantitative Treatment Response Phenotypes are more reliable for each person – other conditions being equal.
- Use many response variables to achieve more comprehensive evaluations of clinical safety and effectiveness for each person – Precision Quantitative Treatment Response Phenotypes are more comprehensive for each person.
- Use SIMA to compute person-specific Overall Benefit and Harm Scores across two or more response variables to reduce the dimensionality of treatment evaluation problems from many to one. Achieve integrated, scientific, and balanced evaluations of clinical safety AND effectiveness. Benefit and Harm Scores are a common metric for evaluating treatment effects regarding time-varying response variables. Differentially weight response variable-specific Benefit and Harm Scores to account for clinical significance and patient preferences before averaging to compute Overall Benefit and Harm Scores.
- Use dose-specific Benefit and Harm Scores to help optimize doses starting at the level of each person. Use SIMA to quantify linear and nonlinear dose-response relationships.
- Use SIMA to separate treatment effect signals from longer-term trends such as spontaneous recovery, disease progression, and assay drift.
- Use SIMA together with multiple repeated measurements at appropriate levels of temporal resolution (e.g., seconds, minutes, hours, days, weeks) to investigate and help distinguish delay and persistence of treatment response. Benefit and Harm Scores that are specific for person, response variable, dose, delay of response, persistence of response, etc. illustrate how SIMA users can compute detailed Precision Quantitative Treatment Response Phenotypes starting at the level of each person.
- Use SIMA to process time series data iteratively and use results to help optimize doses, avoid safety problems, and avoid wasting drugs starting at the level of each person.
- Use the Boolean Independent Events feature of SIMA to help evaluate potential drug/drug interactions starting at the level of each person.
- Use PRCT designs to help optimize continued treatment of each individual in clinical research AND clinical practice.
- Person-specific Benefit and Harm Scores are well suited for statistical analyses when there are two or more persons.
Please see the Scoring Details & Capabilities page here and request the PDF to learn more about SIMA scoring details and selected capabilities.
PRCT versus Classical RCT Designs
Classical RCT designs quantify causality with group averages. This convention confounds individuality with treatment effects and makes it hard to target drug development and patient care to the right persons.
In contrast, PRCT designs use SIMA to quantify causality within persons. Individuality is preserved. Then use the discipline of statistics to aggregate results across two or more persons. Drill down from group results to investigate individual person results.
Classical RCTs are conducted for edification and marketing approval largely for persons other than those who participate as “subjects” as in the book: “How Many Subjects?” PRCT designs investigate individual persons as individual persons.
Conduct PRCTs both for the persons studied as well as additional stakeholders.
Consider ethical advantages of PRCT designs. No person is randomized to only placebo, only an ineffectively low dose, or only an excessive and harmful dose. Use PRCTs to help avoid safety problems and optimize continued treatment for each person.
Classical RCT define primary hypotheses in terms of primary response variables or so-called endpoints such as blood pressure levels. In contrast, PRCTs would define primary hypotheses in terms of Benefit and Harm Scores. Compute Overall Benefit and Harm from multitudes of response variables to achieve scientific, integrated, and balanced evaluations of safety and effectiveness starting at the level of each person.
Classical RCTs designs that focus on efficacy neglect clinical safety. This contributes to high morbidity, mortality, legal liability, and ethical problems.
PRCTs have potential to help draw more patients into clinical trials. Integration of clinical research and practice can reduce need for separate budgets. Consider paying for documented benefit and harm as distinct from paying for drugs. Consider payment starting from the first person forward.
Unlike classical RCT designs, PRCT designs provide reliable, valid, comprehensive, and detailed treatment response phenotypes – a good way to accelerate identification of genetic and other predictors of differential drug response and differential dose requirements.
Although PRCT designs are being illustrated in the context of drug evaluation for persons, essentially the same approach appears to apply for other types of interventions and exposures and for other types of Complex Adaptive Systems. PRCT designs might apply for behavior modification.
Three PRCT Designs
Here is a hierarchy of three PRCT designs. Each subsequent design in this list extends the previous design. Select the right design for your primary purpose and use.
- Single-patient (N of 1) PRCT designs: These have potential to become the new gold standard for the prevention and management of chronic disorders. N of 1 PRCTs are a scientific analogue to how clinicians often evaluate treatments over time for individual patients. Clinicians seeking to optimize the continued care of individuals often assess responses over time during drug challenge, de-challenge, and re-challenge with multiple doses. N of 1 PRCTs make this process more scientific by randomizing and masking doses, including any placebo as zero-dose, over time; collecting multivariate time series about both treatment and health; and using SIMA to compute Precision Quantitative Treatment Response Phenotypes for each person.
- Single-group, multiple N of 1 PRCT designs: These have potential to become the new gold standard for chronic disorder drug development and regulation. Single-group, multiple N of 1 PRCT designs are coordinated sets of N of 1 PRCTs introduced just above. Aggregate results from two or more persons with statistics to describe groups and make inferences from samples of patients to populations.
- Multiple group, multiple N of 1 PRCT designs: These have potential to become a new gold standard for much of comparative safety AND effectiveness research. These are coordinated sets of single-group, multiple N of 1 PRCT designs introduced just above. Use double randomization. Randomize persons to groups defined by two or more types of treatment. Randomize two or more doses, including any placebo, of the same type of treatment over time for each person.
Demonstration
Figure 1 is a simple demonstration of a single-group, multiple N of 1 PRCT design – a coordinated set of three N of 1 PRCTs. Each N of 1 PRCT uses 16 repeated measurements to evaluate the effects of four randomized doses of one type of drug with respect to three response variables. See how Interaction-over-Time (IoT) scores use “Direction” to become Benefit and Harm Scores. The three response variable specific Benefit and Harm Scores for each patient are differentially weighted and averaged to compute an Overall Benefit and Harm Score. Next, the null hypothesis of no Overall Benefit and Harm across the three patients is evaluated statistically with a two-tailed, single-group t-test on the mean. See how the null hypothesis of no overall benefit and harm is rejected in the positive or beneficial direction with only three patients. Benefit and Harm Scores computed from 16 repeated measurements are more reliable indicators of treatment effect than change scores. This makes it easier to achieve statistical significance.
Figure 1 shows how SIMA is used to compute Benefit and Harm Scores for each person before statistical analyses of group results. This illustrates the complementary use of two disciplines – SIMA for individuals and statistics for groups and populations.
Figure 1: A Single-group, Multiple N of 1 PRCT Design
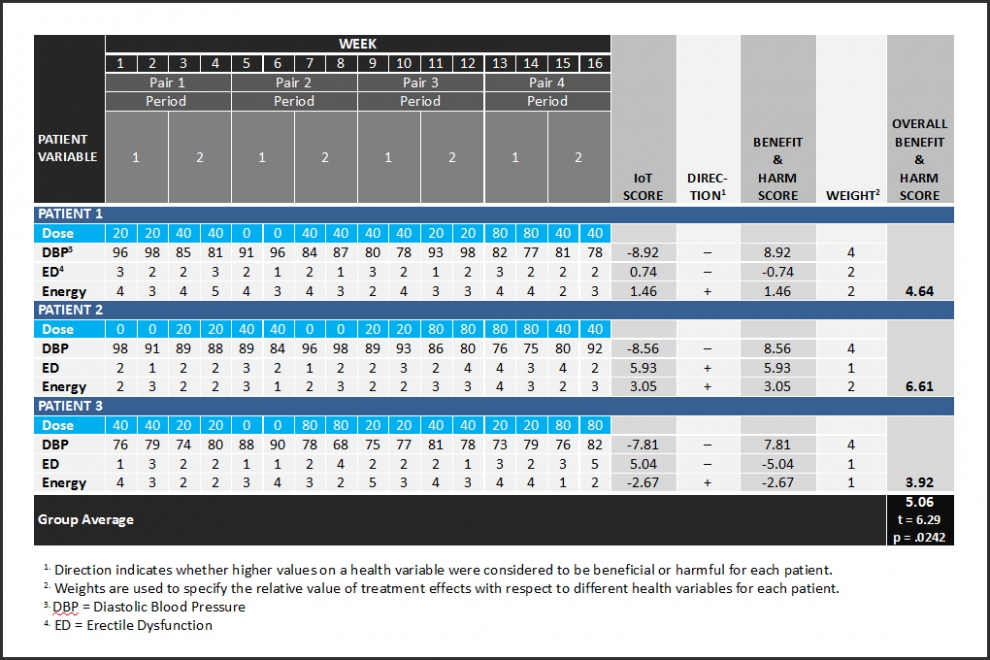
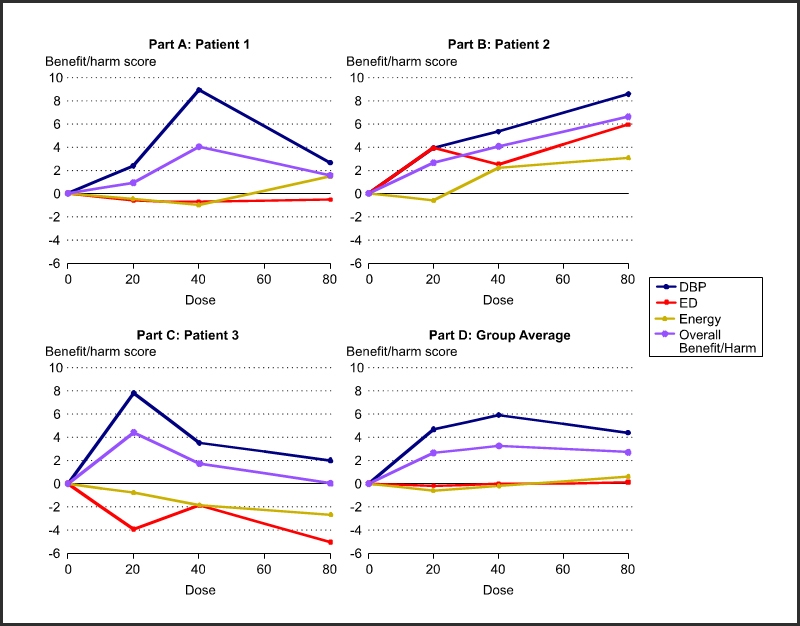
Figure 2 shows response variable specific and overall benefit and harm as a function of dose for each of the three patients in Figure 1. Use such results to optimize doses for each person. Part D shows the statistically aggregated results.
Figure 2: Get Doses Right
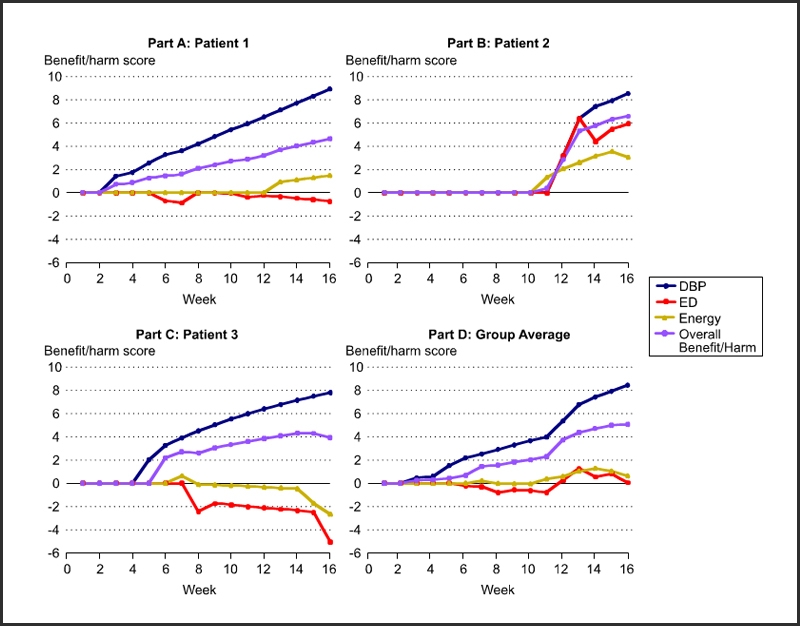
Protect patient safety by processing data in Figure 1 iteratively as shown in Figure 3.
Figure 3: Protect Patient Safety and Reduce Liability
Validity
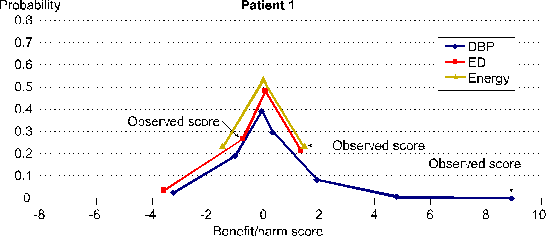
SIMA computes Benefit and Harm Scores that are mathematically valid. Each Benefit and Harm Score is one score from a distribution of potential scores. Distributions of potential scores are defined by the repeated measurements data for one person in combination with a transparent and operationally defined SIMA scoring protocol. Each distribution of potential scores has a mean of 0 and a standard deviation of 1 unless 0 is the only potential score.
Figure 4 shows these distributions of potential scores for all three of the response variable specific Benefit and Harm Scores for Patient 1 shown in Figure 1 in the demonstration just above.
Figure 4. Benefit and Harm Scores Are Mathematically Valid
Randomize and mask doses over time to help assure that Benefit and Harm Scores are also empirically valid.
Collect more repeated measurements to help assure that Benefit and Harm Scores are more reliable.
Figure 2 here shows the distribution of potential scores for the data with 143 repeated measurements that is shown in Figure 1 at the same link.
PRCTs for Rare Disorders
“There are approximately 7,000 different types of rare diseases and disorders, with more being discovered each day” as documented here.
“There are more than 1,800 mutations in the CF gene” as documented here. At least some of these mutations appear to require different treatments.
Many rare disorders are defined genetically. Exposures can affect gene expression and disorders. A few examples can be found through Science Direct and the Human Exposome Project.
Genes, exposures, personal histories, ages, and concomitant conditions – all can affect diagnoses and responses to treatments.
PRCTs are one application of SIMA (Science of Individuality Measurement Algorithm) from DataSpeaks, Inc. Another application of SIMA is to compute Precision Quantitative Diagnostic Phenotypes as introduced here.
Precision Quantitative Diagnostic Phenotypes are more objective, reliable, specific, mechanistic, and actionable compared to diagnoses from the International Classification of Diseases and Diagnostic and Statistical Manual of Mental Disorders. Diagnoses have potential to become as specific as patterns of functional connectivity as for individual person’s brains.
See the emerging pattern here. Diagnoses are becoming as specific as persons.
This does not imply that drugs need to be developed for ever smaller numbers of persons. Many different disorders share common mechanisms. The solution appears to be more mechanism-specific diagnoses – diagnostic phenotypes.
Classical RCT designs attempt to solve the problem of rare diseases with patient stratification. This approach is limited. One needs to know predictors in advance to stratify. Though knowledge of predictors of differential response is still in its infancy, stratification is reaching a point where it is impossible to study enough subjects to achieve statistical significance. Classical RCT designs do not provide reliable, valid, comprehensive, and detailed treatment response phenotypes needed to help identify predictors.
PRCT designs address all these and additional problems as a set.
Problems of drug development for rare disorders are gaining much unfavorable attention for those who insist on classical RCT designs: http://www.wsj.com/articles/mental-dystrophy-at-the-fda-1461885588.
Transitioning to PRCT Designs
Transitioning from classical RCT designs to PRCT designs will take time, effort, and leadership. Regulatory agency guidelines are based on classical RCT designs. The pharmaceutical industry understandably follows. Statisticians drive RCT design. SIMA is a somewhat disruptive measurement solution that offers statisticians new measures to analyze. Universities teach classical RCT designs with some variations such as trial designs that use Bayesian statistics. To the best of my knowledge, no one actually quantifies benefit and harm with reliable and valid scores before aggregating across persons with statistics. Fortunately, there are many paths forward and toward PRCT designs – pathways both inside and outside clinical trials.
Drug development typically fails. Figure 5 illustrates Eroom’s Law.
Figure 5. Eroom’s Law
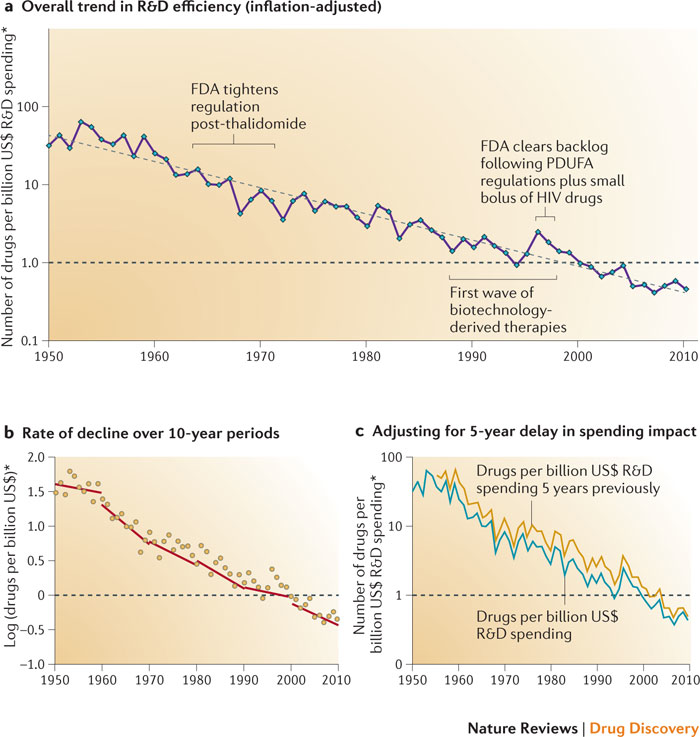
There appears to have been some R&D efficiency improvement in 2014. However, there is little sign that stakeholders are addressing scientific and technical root causes of Eroom’s Law.
Eroom’s Law has left many failed and underperforming drugs in its wake. Such failure creates opportunities to rescue and repurpose drugs, recover sunk costs, and help other stakeholders.
Classical RCTs are not well designed for medicine that treats individual patients. Data from classical RCTs are far from ideal for computing Benefit and Harm Scores with SIMA. However, there are multiple opportunities to mine data from classical drug development. Use resulting insights to improve classical RCTs. At the same time, researchers become familiar with SIMA and its capabilities. Eventually, PRCT designs are apt to take hold in accord with their merits.
Here are three ways that researchers can use SIMA to mine data from classical drug development.
- Classical RCTs often use change scores computed from baseline and endpoint measurements. Often there are additional intervening measurements. To illustrate, an 8-week classical RCT might have nine repeated measurements – one baseline and eight additional weekly repeated measurements. One approach for analyzing such data is to test the primary hypothesis with baseline to endpoint change scores. Secondary analyses might test baseline to 2, 4, and 6-week change scores. In contrast, use SIMA to compute Benefit and Harm Scores from all nine repeated measurements simultaneously to gain power and investigate benefit and harm as a function of delay of response.
- Phase 1 and 2 clinical trials might collect data on blood levels of drug and drug metabolites. Use SIMA to investigate drug effects as functions of blood levels of drug and drug metabolites.
- Knowledge about mechanisms of disease and treatment response is precious. A recent search of https://clinicaltrials.gov/ found 1547 results for fMRI – functional Magnetic Resonance Imaging. Some of these trials apply fMRI before and after treatment. Consider applying SIMA to measure functional connectivity between brain regions. Difference before and after treatment measures of functional connectivity to help elucidate mechanisms of treatment effect.
SIMA has many applications in addition to enabling PRCTs. Such applications that might gain traction faster. Additional applications can help validate SIMA in practice and help drive users toward PRCT designs.
Precision medicine needs PRCT designs.
Beyond Disruption
Statisticians drive classical RCT designs and typically use group averages to assess causality.
In contrast, PRCT (Precision RCT) assess causality over time within individuals as clinicians often do informally in clinical practice.
Figure 1 in the Demonstration section above illustrates a PRCT.
- SIMA (Science of Individuality Measurement Algorithm) was used to quantify the amount of evidence for causality (benefit and harm) within each of the three patients BEFORE
- Statistics was applied to Benefit and Harm Scores to describe the group and make an inference from the sample to the population.
SIMA and statistics appear to be two distinct and often complementary disciplines for learning from data. Both disciplines use probabilities to help account for uncertainty.
Statisticians would cede some ground about causality assessment to help advance PRCT designs. What would they gain in return? All of the following opportunities derive from SIMA yielding a new category of derived measures that statisticians can analyze and model mathematically. These derived measures are illustrated by the seventh and last figure at the DataSpeaks home page.
- Medicine and RCTs would be more targeted with better diagnostic taxonomies of diseases and disorders. SIMA enables a new approach to quantify how persons function over time over time. This introduces the use of IoT (Interaction over Time) scores from SIMA to compute Precision Quantitative Diagnostic Phenotypes. Statisticians would be crucial for clustering IoT scores into diagnostic clusters that improve upon ICD and DSM categories.
- In turn, statisticians would be crucial to help identify genetic and other predictors of Precision Quantitative Diagnostic Phenotypes.
- Unlike classical RCTs, PRCTs can yield reliable, valid, comprehensive, and detailed Precision Quantitative Treatment Response Phenotypes. Statisticians would be crucial to help identify genetic and other predictors of differential responses and optimal doses.
- Figure 1 in the Demonstration section just above illustrates differential directions to convert IoT scores to Benefit and Harm Scores. For example, is the effect of Drug A to reduce levels of Lipid Fraction X beneficial or harmful? In addition, Figure 1 shows differential weights that were applied to response variable-specific Benefit and Harm Scores before computing Overall Benefit and Harm Scores. Differential weights account for clinical significance. For example, how much do reductions in Lipid Fraction X affect risk of heart attack, stroke, or death? Statisticians would be crucial for doing the clinical epidemiology required to determine such directionalities and weights.
- Knowledge about mechanisms of health, disorders, and treatments is precious. PRCTs can quantify treatment effects with respect to multitudes of response variables simultaneously. Statisticians would be crucial for identifying treatment effect factors across response variables and persons. Anticholinergic effects are an example of a treatment effect factor.
Together, experts in SIMA and statistics can advance basic and applied sciences of Complex Adaptive Systems. This includes persons and brains.